On every site you go regarding data science workflow, it starts with defining the problem, gathering/cleaning and exploring the data. However, what to do after you are done with exploratory data analysis. The next two steps includes building a model and evaluating your model to answer the problem.
In this post I will try to explain the first model that I implemented, Linear Regression. I will touch upon both test/train split and cross-validation to score our model as they are good habits to practice in the field of Data Science.
NOTE: I try to keep math under the hood and keep it to only programming.
Linear regression is a statistical model that examines relationship between a dependent variable(y variable) and independent variables(one or more variables of x).
If the model is examining relationship between two variables (x and y), the model is called a Simple Linear Regression(SLR). Mathematically, SLR can be represented as y = b0 + b1x1.
On the other hand, if we are examining relationship between more than two variables(y and multiple values for x - also represented as X), the model is called a Multiple Linear Regression and it is represented as y = b0 + b1x1 + b2x2...bnxn.
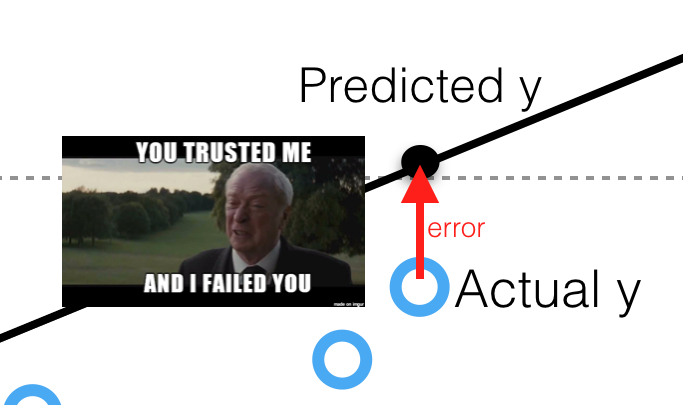
In order to understand this model, we should also understand the concept of residuals. Residuals are basically the differences between the true value of y and the predicted values of y, also known as ŷ. All in all, our goal to find a "line of the best fit" and to minimize the distance between the blue dots and the red line. In mathematical terms, we are trying to minimize mean squared error(MSE) or the sum of squares of error(SSE), also called the 'residual sum of square'.
Enough with explanation. Let's load some data and get going with implementing multiple linear regression.
    #Loading the data
    import pandas as pd
    df = pd.read_csv('sacramento.csv')
    df.head(2)
TIP: Remember IMPORT, INSTANTIATE and FIT
    #Import
    from sklearn.linear_model import LinearRegression
    #Instantiate
    linreg = LinearRegression()
    X = df[['sq_ft']].copy()
    y = df[['price']]
    #Fit
    model = linreg.fit(X,y)
.predict uses the linear model and returns predicted values of y using X.
yhat = linreg.predict(X)
.score returns the coefficient of residual sum of squares (R^2) of the prediction. The best score is usually between 0.0 and 1.0. However, be suspicious if you get 1.0 Also, if you get negative number that could mean that the model is arbitrarily worse.
    yhat = yhat.reshape(-1,1)
    yhat.shape
    model.score(y,yhat)
Here are some useful methods to get slope and intercept. Learn more about there here!
    print("The slope is "+ str(model.coef_))
    print("The intercept is" + str(model.intercept_))

Train/Test Split and Cross Validation
Now that we know how to implemented linear regression, let's take a step back.
For obvious reasons, using the entire data set to predict the model is not a good idea, as we cannot determine if our model is overfitting or underfitting. Not sure what is overfitting and underfitting? Check my post.
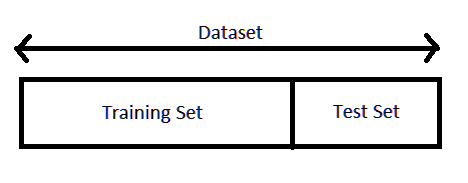
Train/Test Split, splits the data into training dataset and a test dataset. We then use the training dataset to train the model and testing dataset to test or evaluate the model. This ensures that our model is not making prediction regarding the values it has already 'seen'. See the following code to learn how to implement train/test split.
    from sklearn.model_selection import train_test_split
    X_train, X_test, y_train, y_test = train_test_split(X, y, test_size = 0.2, random_state = 42)
    linreg.fit(X_train, y_train)
    linreg.score(X_train,y_train)
linreg.score(X_test, y_test)

Seems good, right? But what if, the split isn't random as it seems. What if only certain types of the houses are captured in our training dataset or it only captures homes in one city. This is where cross validation comes in. There are multiple different types of cross validation, however in this post we will be focusing on K-Fold cross-validation.
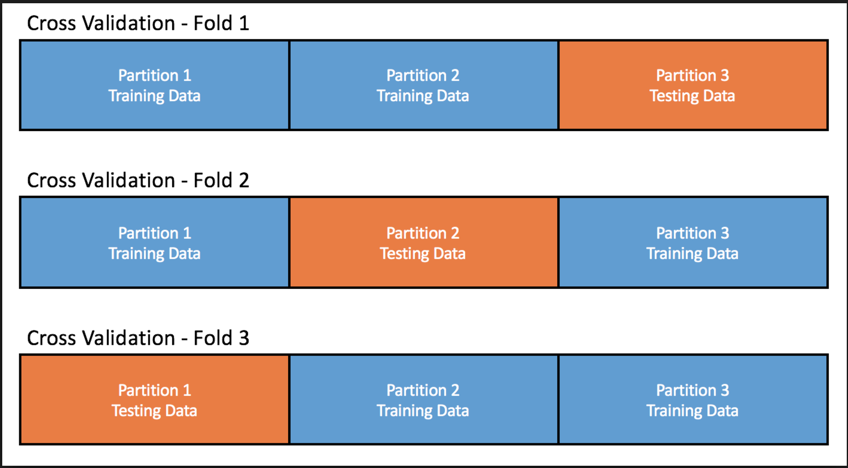
K-Fold Cross-validation, is very similar to train/test split, however it splits the dataset into k number of bins. For instance, if you have 150 rows in a dataset and your k = 3 bins, how many data points you have in each bin? 50 data rows in each dataset. So if you run 3-Fold cross validation on your data, it would pick one of the three sub-divisions as testing set and the other two as training dataset. It would fit the model on the training dataset, score the model on the testing dataset and run this process k times. You can the use the cross_val_score to get the $R^2$ score for each testing set.

TIP: Remember IMPORT, INSTANTIATE and FIT
    import numpy as np
    from sklearn.model_selection import KFold
    from sklearn.model_selection import cross_val_score

    kf = KFold(n_splits= 35, random_state=42, shuffle=True)
cross_val_score outputs the score of each of the test. In the code below we are getting a mean to verify.
np.mean(cross_val_score(model, X_train, y_train, cv=kf))
np.mean(cross_val_score(model, X_test, y_test, cv=kf))
When there is a significant difference between the model score for training and testing model, it means that the model is either overfit or underfit. You can "regularize" regression models to avoid overfitting, however that would be a post for another day.